

ONE IMAGE | 1969 Regional Plan for the Triangle
BIGGER PICTURE | Way more concentrated density, way less sprawl. What went wrong?
One Image (One Map, One Graph, One Image that Matters) is a series pilot that looks at data and imagery in central North Carolina to better explain our built environment. It is available to subscribers.
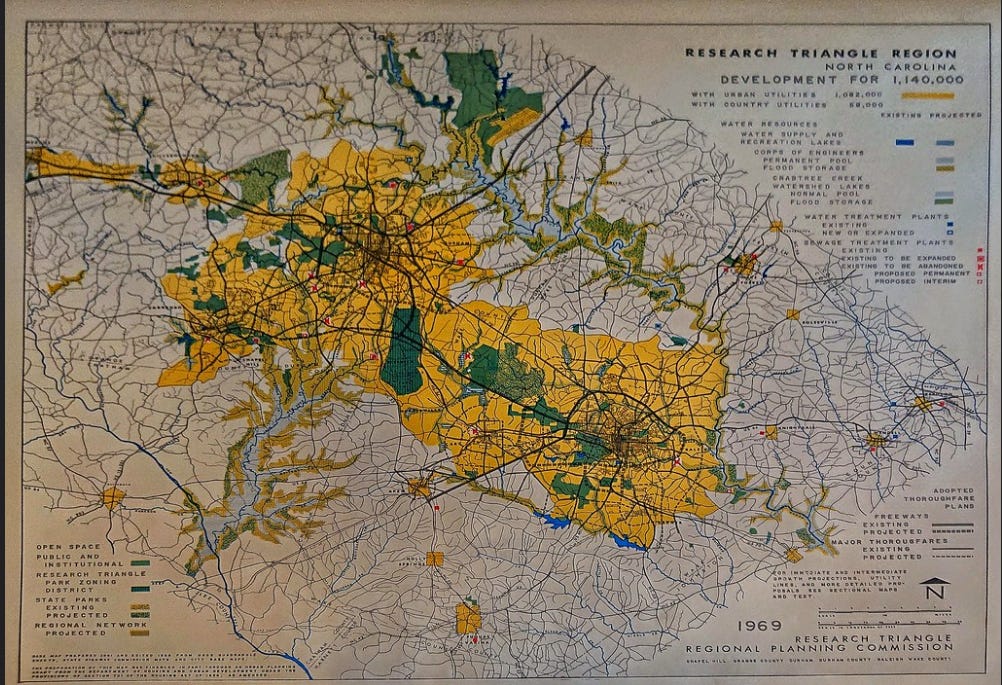
The 1969 Regional Planning Commission plan for the Triangle showcases the expected boundary edges of development, predicting a metro of 1,140,000. At the time, Raleigh’s population was less than 150,000.
What is remarkable about the drawing today? And why does it matter?
There really is no Regional Planning Commission today, and the failure to plan regionally is one of the reasons the metro is sprawled to the extreme today.
The plan implies a relatively hard boundary, even an urban growth boundary, that mostly never came to fruition.
With the late 1960s being peak white-flight, there appears to be no ambition to density or urbanize anything. The map implies that growth is sprawl, and sprawl is growth.

 | A guest post by
|